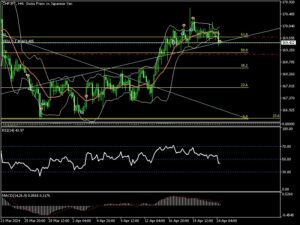
On the 4-hour #timeframe, we can see that the pair has been moving sideways around the 61.8 #Fibonacci level for the past three days until it managed to break below this level today and closed a candle below it.
The bearish trend is supported by the #RSI indicator on the same timeframe, as we can see that the indicator has crossed below the 50 level, indicating bearish momentum. Additionally, there are several lows on the RSI indicator, suggesting a bearish bias.
On the #Bollinger #Bands indicator on the same timeframe, a new candle has opened below the lower band, giving an impression of further downward movement. This #analysis is based on the 4-hour timeframe and the indicators placed on the chart by the #Forex_trade_Time #analyst #team #manger.
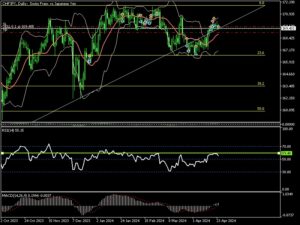
On the daily timeframe, we can see that the pair has faced resistance at certain highs and failed to break above them, starting to reverse its direction towards the 50 level.
On the #Bollinger Bands indicator, after touching the upper band for several days, the pair has started to move downwards today with a clear candle. Therefore, the #Forex #Trade #Time #analyst #team #manger advises monitoring the markets for bearish opportunities while maintaining good capital management
.
#everyday_information #forex #option #Binary_Option #trading #trader #goldstocks #forextrader #fx_trade_time #fxttime #USDollar #euro #JPY #GBP #chfcurrency
#dubai #UAENews #ksasaudiarabia #Syrian #iraq #kuwait #jordan #morocco #Libya #tunisia #algerian #Egypt #qatar #lebanon
#كل_يوم_معلومه #فوركس #خيارات_ثنائيه #تداول_عملات #بورصه #ذهب #فوركس_تريد_تايم #اف_اكس_تريد_تايم #دولار #يورو
#دبي #امارات #السعوديه #سوريا #العراق #الكويت #الاردن #المغرب #ليبيا #تونس #الجزائر #مصر #قطر #لبنان
.
www.fxttime.com/trade


