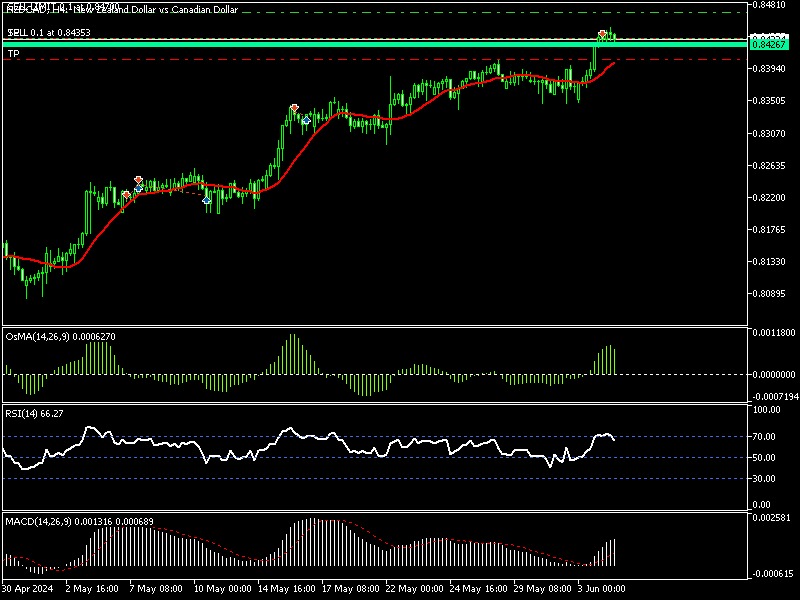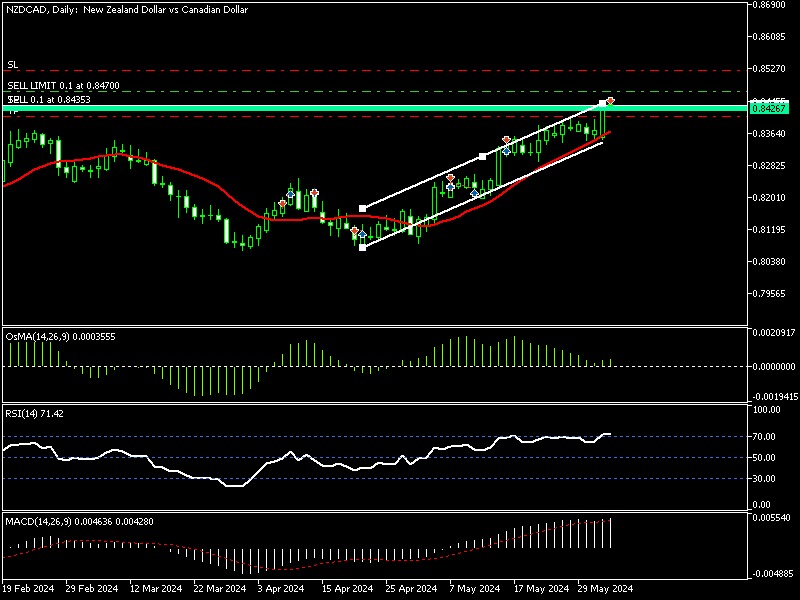
The #pair has been moving in an uptrend during the previous periods. On the daily timeframe, we notice that the #price is facing a strong resistance area that it has bounced off #several times previously. With the #RSI indicator breaking above the 70 level on the same timeframe, we also note that the #OSMA indicator is giving a bearish correction signal.
On the 4-hour timeframe, we also see what confirms the analysis of the Forex Trade Time team on the daily timeframe. Here we see that the RSI indicator has shown a clear bearish #signal, as well as the OSMA indicator, and the #price has started to retrace to make a bearish correction. Potential downside opportunities may appear that can be captured to achieve successful targets while maintaining a moderate risk level.
.
#everyday_information #forex #option #Binary_Option #trading #trader #goldstocks #forextrader #fx_trade_time #fxttime #USDollar #euro #JPY #GBP #chfcurrency
#dubai #UAENews #ksasaudiarabia #Syrian #iraq #kuwait #jordan #morocco #Libya #tunisia #algerian #Egypt #qatar #lebanon
#كل_يوم_معلومه #فوركس #خيارات_ثنائيه #تداول_عملات #بورصه #ذهب #فوركس_تريد_تايم #اف_اكس_تريد_تايم #دولار #يورو
#دبي #امارات #السعوديه #سوريا #العراق #الكويت #الاردن #المغرب #ليبيا #تونس #الجزائر #مصر #قطر #لبنان
.
www.fxttime.com/trade


