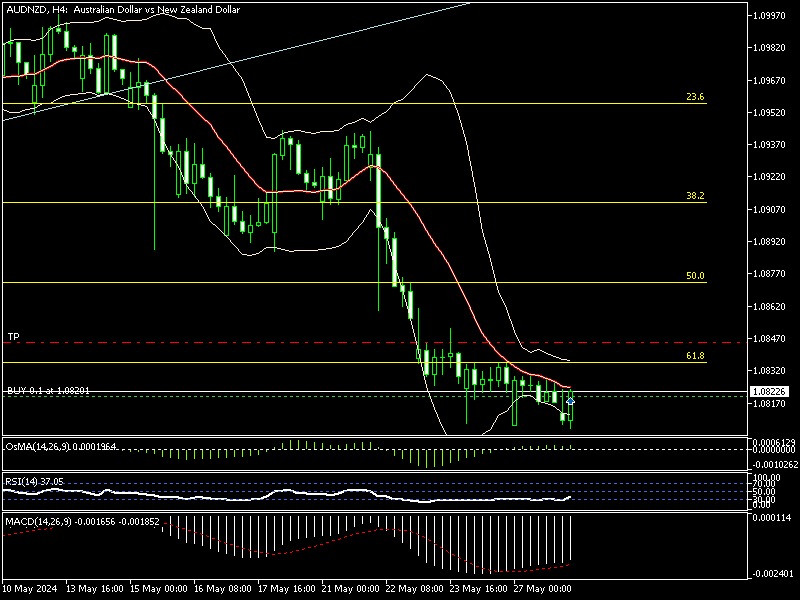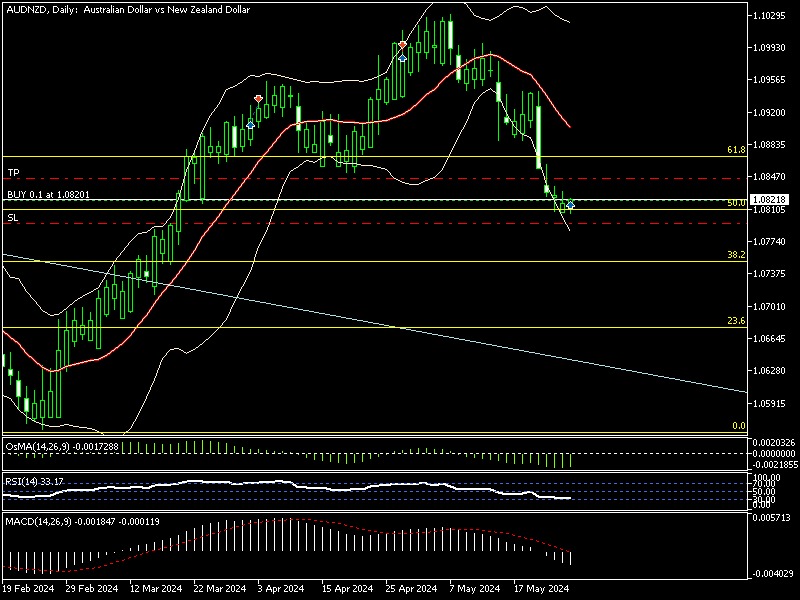
On the daily time frame, the #price has fallen during the previous periods until it reached an area of overselling, and this is evident in most of the indicators.
On the #Bollinger Bands indicator for the same time frame, we notice that the price is #trading at the lower band of the indicator and we find that it has formed a clear bullish candle.
On the same time #frame, by plotting #Fibonacci, we notice that the price has reached the 50% level, but it was unable to break through the level and has started to rebound from it.
Also, on the same time #frame, we find that the #RSI indicator has touched the 30 level, and although this is not a strong signal for a #reversal, the rest of the indicators give a clear signal for an imminent bullish correction, and this is what the Forex Trade Time #analysts team prefers, and buying opportunities will be #strong during the coming period.
.
#everyday_information #forex #option #Binary_Option #trading #trader #goldstocks #forextrader #fx_trade_time #fxttime #USDollar #euro #JPY #GBP #chfcurrency
#dubai #UAENews #ksasaudiarabia #Syrian #iraq #kuwait #jordan #morocco #Libya #tunisia #algerian #Egypt #qatar #lebanon
#كل_يوم_معلومه #فوركس #خيارات_ثنائيه #تداول_عملات #بورصه #ذهب #فوركس_تريد_تايم #اف_اكس_تريد_تايم #دولار #يورو
#دبي #امارات #السعوديه #سوريا #العراق #الكويت #الاردن #المغرب #ليبيا #تونس #الجزائر #مصر #قطر #لبنان
.
www.fxttime.com/trade


